A 64-year-old with a one-hour history of chest pain. Why does the QRS look so wide?
- Left Bundle Branch Block.
- STEMI (Tombstone).
- Left Ventricular Hypertrophy.
- Pre-excitation (WPW).
- Intraventricular conduction delay.
The right answer:
2. STEMI (Tombstone).
Explanation:
The QRS duration is normal. What may appear to be a wide QRS in leads V2-V6 (and can easily be mistaken for hyperkalemia) is actually massive ST elevation due to acute transmural anterior myocardial infarction here. There is reciprocal inferior lead ST depression. Also, Q waves are starting to appear in the precordial leads. This ST pattern, called “tombstone” or “shark fin” depending on which lead you’re looking at, is more technically known as a “monophasic current of injury” – explained below. This is also the pattern you see if you touch the epicardium of the heart with a needle (e.g., during pericardiocentesis with an alligator ECG lead clipped on the needle).
Figuring out the ST elevation from true wide QRS:
With this unique morphology, the QRS complex and T-wave merge together due to extreme ST-Deviation, and the two become indistinguishable. But remember this: If you can find the end of the QRS in one lead, you can find the end of the QRS in any lead. Look in all 12 leads and find one which clearly shows the end of the QRS. Here, leads II and V1 show the beginning and end of the QRS very nicely. Now all you have to do is draw a line straight up from this point (J-point) in leads II and V1, and you can find the same point in any lead (The J point denotes the junction of the QRS complex and the ST segment on the ECG, marking the end of depolarization and beginning of repolarization.)

Figure 1: Here is the same 12-Lead ECG with vertical lines drawn at the J-points
There are other examples of potentially lethal ECGs – also called “widow-makers” – that can be confused with other disorders associated with wide QRS (figure 2). Despite the lack of good evidence about these ECG patterns, the literature suggests they are associated with worse outcomes, including lethal arrhythmias.
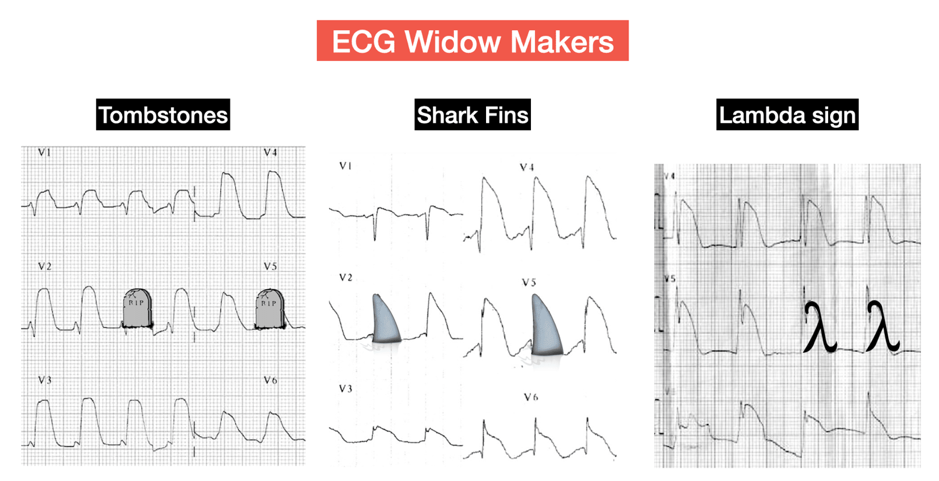 Figure 2: ECG widoe-makers
Extra food for the brain – pathophysiology and physics
Current of injury
Hypoxia of the myocardium leads to diminished intracellular concentrations of ATP. The loss of ATP leads to decreased activity of ATP-dependent transport systems, including the Na+/K+-ATPase pump that normally transports K+ into the cell and Na+ out of the cell, which helps maintain the polarized state across the myocardium after an initial depolarization.
Loss of pump activity prevents K+ from being pumped back into the cell so that its extracellular concentration increases and contributes to membrane depolarization. A current is subsequently formed between the damaged and healthy myocardium (green arrows in figure 3). This current doesn’t exist in the normal myocardium. In the injured myocardium, this causes continuous current even during the time when the ECG is drawing what should be an isoelectric line (TP and PR segment). Remember that the TP segment is the ideal isoelectric part of the ECG.
With complete coronary occlusion, the ischemic region and subsequent infarcted tissue spans the entire muscle wall thickness from endocardium to epicardium (i.e., transmural ischemia). ST-segment elevation occurs because when the ventricle is at rest and therefore repolarized, the depolarized ischemic region generates electrical currents that are traveling away from the recording electrode; therefore, the baseline voltage prior to the QRS complex is depressed (red line before R wave in figure 3). When the ventricle becomes depolarized, all the muscle is depolarized during the ST segment so that zero voltage is recorded by the electrode (red line after R wave in figure 3). When the ventricle is completely repolarized after the T wave, the baseline is once again negative as in the resting state. Therefore, the net effect of the depressed baseline voltage is that the ST segment appears to be elevated relative to the baseline. So what looks like an ST elevation is actually a depressed baseline (ST depression of ischemia occurs due to baseline elevation since it is only subendocardial ischemia and the direction of current is different from transmural infarction).

References:
- Nathanson LA, McClennen S, Safran C, Goldberger AL. ECG Wave-Maven: Self-Assessment Program for Students and Clinicians. http://ecg.bidmc.harvard.edu.
- Stephen W. Smith. Dr. Smith ECG blog. https://hqmeded-ecg.blogspot.com/
- S. Patil et al., “Tombstone ST-segment elevation in acute anterior wall myocardial infarction,” IHJ Cardiovasc. Case Reports, vol. 2, pp. S11–S13, 2018.
- Richard E. Klabunde. Cardiovascular physiology concepts. https://www.cvphysiology.com/CAD/CAD012.